OpenTelemetry
🌐 Traducción por IA y humanos
Esta traducción fue hecha por IA guiada por humanos. 🤝
Podría tener errores al interpretar el significado original, o sonar poco natural, etc. 🤖
Puedes mejorar esta traducción ayudándonos a guiar mejor al LLM de IA.
Cuando tu API está en funcionamiento, puede que quieras saber cuánto tráfico recibe, qué requests son lentas y cuándo se producen errores.
La telemetría son datos sobre el comportamiento de tu aplicación que te ayudan a responder estas preguntas. Algunos tipos comunes son:
- Métricas: mediciones que puedes resumir a lo largo del tiempo, como los tiempos de response y el número de requests que se están procesando.
- Trazas: registros de requests individuales y de las operaciones realizadas para procesarlas. Cada operación cronometrada se llama span.
- Logs: registros de eventos con marcas de tiempo, como el inicio de una aplicación o el fallo de una operación.
OpenTelemetry es un conjunto de estándares y herramientas para recopilar telemetría y enviarla a un servicio de monitorización, donde puedes explorarla en paneles.
FastAPI proporciona soporte para OpenTelemetry por defecto para trazas, métricas y logs de requests HTTP. Las conexiones WebSocket también proporcionan trazas y logs. Para ver esos datos, configura un servicio de monitorización que los reciba.
Instala FastAPI
Instala FastAPI con los extras standard, que incluyen los paquetes para enviar telemetría:
$ uv add "fastapi[standard]"
---> 100%
Crea la aplicación
Crea un archivo main.py:
from fastapi import FastAPI

app = FastAPI()


@app.get("/items/{item_id}")
async def read_item(item_id: int):
    return {"item_id": item_id}
No necesitas escribir ningún código personalizado para recopilar telemetría.
FastAPI Cloud
Cuando despliegas en FastAPI Cloud con fastapi[standard], las métricas funcionan automáticamente. No tienes que configurar nada más.
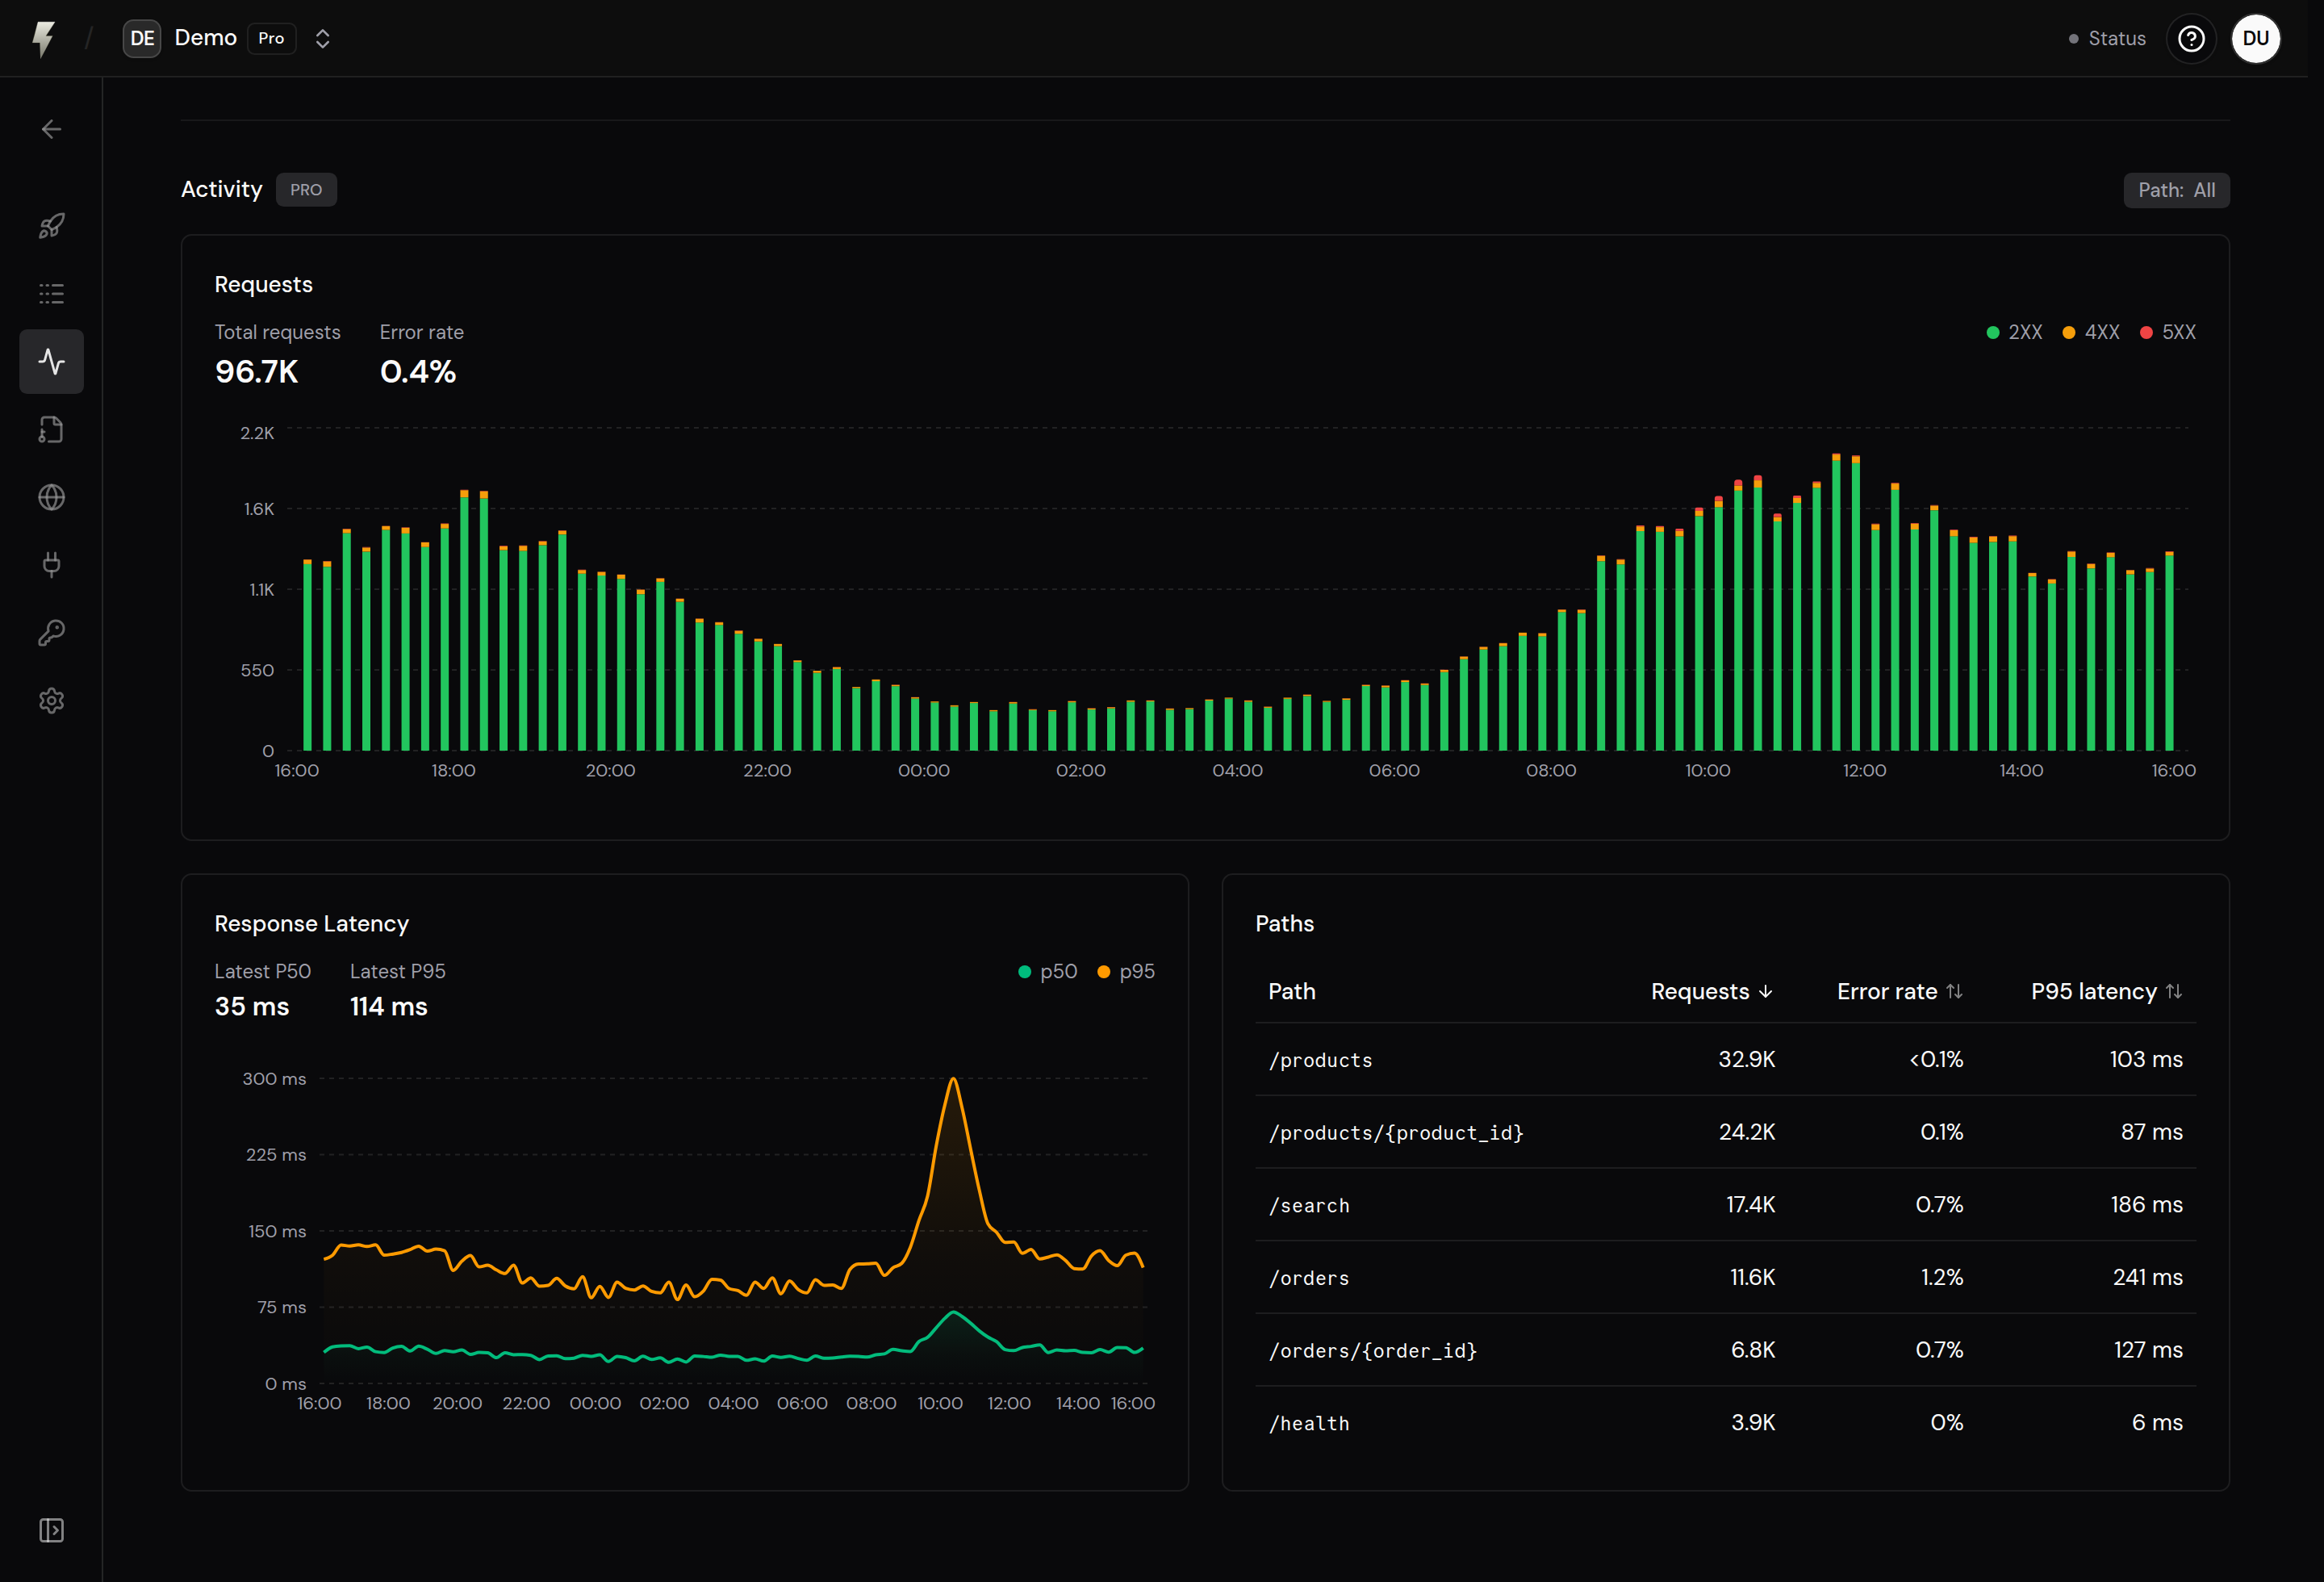
En los planes Pro, puedes ver el número de requests, las tasas de error y los tiempos de response en el panel de métricas.
Otros servicios de monitorización
Para enviar telemetría a otro servicio de monitorización, configura un endpoint que acepte OTLP, el protocolo de OpenTelemetry para enviar telemetría. Usa el endpoint base HTTP/protobuf del servicio.
Establece estas variables de entorno, reemplazando la URL de ejemplo por tu endpoint:
export FASTAPI_OTEL_AUTO_CONFIGURE=true
export OTEL_SERVICE_NAME=my-api
export OTEL_EXPORTER_OTLP_ENDPOINT=https://collector.example.com
FASTAPI_OTEL_AUTO_CONFIGURE=true activa la configuración automática de exportadores de FastAPI. OTEL_SERVICE_NAME identifica tu aplicación en el servicio de monitorización. El endpoint es la URL base para recibir datos. Las trazas se envían a /v1/traces, las métricas a /v1/metrics y los logs a /v1/logs bajo esa URL.
Si tu servicio requiere autenticación, establece OTEL_EXPORTER_OTLP_HEADERS con los headers que especifique, por ejemplo api-key=YOUR_API_KEY.
Ejecuta la aplicación
Inicia la aplicación en la misma terminal:
$ uv run fastapi run
En otra terminal, envía una request:
$ curl http://127.0.0.1:8000/items/1
{"item_id":1}
Abre tu servicio de monitorización y busca my-api. Después de la siguiente exportación, podrás ver una traza con un span GET /items/{item_id}, junto con métricas del número de requests, la duración de las responses y las requests activas.
Personaliza la telemetría
Configura proveedores y exportadores
Un proveedor proporciona los objetos que registran trazas, métricas o logs. Su configuración controla cómo se procesan y exportan esos datos.
Los paquetes de telemetría pueden configurar los proveedores globales de OpenTelemetry. Configura el paquete antes de que se inicie la aplicación y FastAPI usará esos proveedores automáticamente.
Por defecto, FastAPI usa los proveedores configurados sin añadir exportadores. Cuando la configuración automática está activada y se establece un endpoint OTLP en el entorno, FastAPI añade un exportador para ese destino a cada proveedor habilitado. Los exportadores existentes siguen enviando datos a sus destinos.
Si otro paquete ya configura la exportación al mismo destino, deja FASTAPI_OTEL_AUTO_CONFIGURE sin establecer o establécelo en false para evitar telemetría duplicada.
También puedes pasar un proveedor directamente en el diccionario telemetry. Por ejemplo, este proveedor usa el exportador de consola de OpenTelemetry para imprimir los spans de las requests en tu terminal:
from fastapi import FastAPI
from opentelemetry.sdk.trace import TracerProvider
from opentelemetry.sdk.trace.export import BatchSpanProcessor, ConsoleSpanExporter

tracer_provider = TracerProvider()
tracer_provider.add_span_processor(BatchSpanProcessor(ConsoleSpanExporter()))

app = FastAPI(telemetry={"tracer_provider": tracer_provider})


@app.get("/items/{item_id}")
async def read_item(item_id: int):
    return {"item_id": item_id}
El exportador envía los spans a su destino. BatchSpanProcessor agrupa los spans y los envía en segundo plano. Reemplaza el exportador de consola por uno proporcionado por tu paquete de monitorización para usar su destino. Consulta la guía de instrumentación de Python de OpenTelemetry para ver más opciones de configuración.
Usa meter_provider o logger_provider en el mismo diccionario para proporcionar un proveedor de métricas o logs. La aplicación o el paquete que crea un proveedor gestiona su cierre. FastAPI gestiona los componentes de exportación que añade.
Advertencia
OpenTelemetry usa proveedores globales por defecto. No se garantiza una configuración de telemetría independiente para las subaplicaciones montadas.
Traza las operaciones de las requests
Por defecto, las trazas de las requests incluyen spans para resolver dependencias, ejecutar tu path operation function, serializar la response y ejecutar cada tarea de BackgroundTasks de FastAPI. Estos spans usan el mismo proveedor y los mismos exportadores.
Los spans de las tareas en segundo plano siguen formando parte de la traza de la request. Se ejecutan después de que termine el span de la response HTTP, por lo que no aumentan el tiempo de response medido.
Para registrar solo el span de la request HTTP, establece operation_spans en False:
from fastapi import FastAPI

app = FastAPI(telemetry={"operation_spans": False})


@app.get("/items/{item_id}")
async def read_item(item_id: int):
    return {"item_id": item_id}
Traza las conexiones WebSocket
Cada conexión WebSocket tiene un span como WS /ws/{room}, que abarca el manejador y la limpieza de las dependencias. Usa los mismos proveedores y ajustes, incluido operation_spans para la resolución de dependencias y la ejecución del endpoint.
Las métricas de requests HTTP abarcan únicamente requests HTTP. Las desconexiones normales de WebSocket con los códigos 1000 o 1001 no generan logs de error.
Inspecciona los errores
FastAPI registra las excepciones no controladas como logs de OpenTelemetry, vinculados a la traza de la request o de la conexión. Los logs de error se registran incluso cuando la traza no se incluye en el muestreo.
Los logs de excepciones incluyen el tipo, el mensaje y la traza del stack de la excepción. Los mensajes y las trazas del stack pueden contener información sensible. Usa los procesadores de logs de tu proveedor para filtrarlos u ocultar la información sensible, o establece logs en False para desactivar estos logs.
FastAPI también registra los fallos de validación de las requests como logs de advertencia con la ruta y el número de errores. Estos logs no incluyen la entrada no válida.
Elige qué registrar
El diccionario telemetry también acepta estos ajustes:
| Ajuste | Propósito | Por defecto |
|---|---|---|
tracing |
Registrar spans de requests HTTP y conexiones WebSocket | True |
metrics |
Registrar métricas de requests HTTP | True |
logs |
Registrar fallos de validación y excepciones no controladas | True |
operation_spans |
Añadir spans para las operaciones de las requests | True |
exclude |
Omitir requests cuando una función que recibe el scope de ASGI devuelve True |
None |
auto_configure |
Añadir exportadores para los endpoints establecidos en variables de entorno | True si FASTAPI_OTEL_AUTO_CONFIGURE=true, de lo contrario False |
Por ejemplo, para recopilar métricas excluyendo las verificaciones de estado:
from fastapi import FastAPI

app = FastAPI(
    telemetry={
        "tracing": False,
        "exclude": lambda scope: scope["path"] == "/health",
    }
)
Un valor explícito de auto_configure en el diccionario telemetry tiene prioridad sobre FASTAPI_OTEL_AUTO_CONFIGURE. Usa telemetry={"auto_configure": True} para activar la configuración automática en el código, o telemetry={"auto_configure": False} para desactivarla en una aplicación incluso cuando la variable de entorno la active.